23 December 2022
High-temperature storage (Aquifer Thermal Energy Storage or ATES) is defined as the storage of heat in the subsurface at times when there is oversupply (usually in summer), and to use it during a cold period. The calculation of the potential of the subsurface for ATES depends on factors different from those for deep geothermal, like for instance the importance of a sealing clay layer, the combination of hot water injection in summer and production in winter, the fact that a borehole is used alternately for production and injection, the possibly varying number of boreholes in an installation, and the importance of recovery efficiency. The economic model is also different.
ThermoGIS-ATES potential maps
A 'ThermoGIS-ATES' application has been developed in WarmingUP theme 5 to map the potential of high-temperature storage in the subsurface of the Netherlands. The current ThermoGIS application for geothermal energy was used as a basis for the calculations by extending it with three models:
- a subsurface thermal simulator (ROSIM-DoubletCalc3D);
- an technical model for ATES systems;
- a generic cost model.
Update calculation tool
The calculations done in ThermoGIS-ATES, such as of flow rate (m³/h), are still under development and therefore not yet available at www.ThermoGIS.nl. There are not yet enough examples of operational ATES projects that can be used for verification and calibration of the models. The calculation tool is regularly updated based on new insights.
Input for calculations
(Hydro-)geological maps such as those of the depth, thickness and permeability of subsurface sand layers are used as input for the calculation of ATES potential. For the application of ATES, a depth between ~100-500 m ('moderately deep') is often considered. This is shallower than the depth of most ThermoGIS layers. Therefore, the available hydrogeological maps for this specific depth range are from the Regional Geohydrological Model REGIS II v2.2. The depth and thickness maps are based interpolation between boreholes. Where the availability of boreholes is small, the maps are less certain. In WarmingUP GOO, a follow-up to WarmingUP starting in 2023, work will include improving the moderately deep regional hydrogeological models. These will eventually also be used for the ThermoGIS-ATES application.
Furthermore in WarmingUP GOO, TNO, together with research partners, industry, governments and other interested parties, is investigating the improvement of calculation methods. We are also assessing the extent to which rules of thumb and new input (from local or regional studies, for example) can contribute to improving the potential maps. The aim is to better unlock the subsurface potential for ATES. This will also enable improved initial screening for ATES projects..
Input is most welcome. You are cordially invited to contact TNO if you have any interest or ideas.
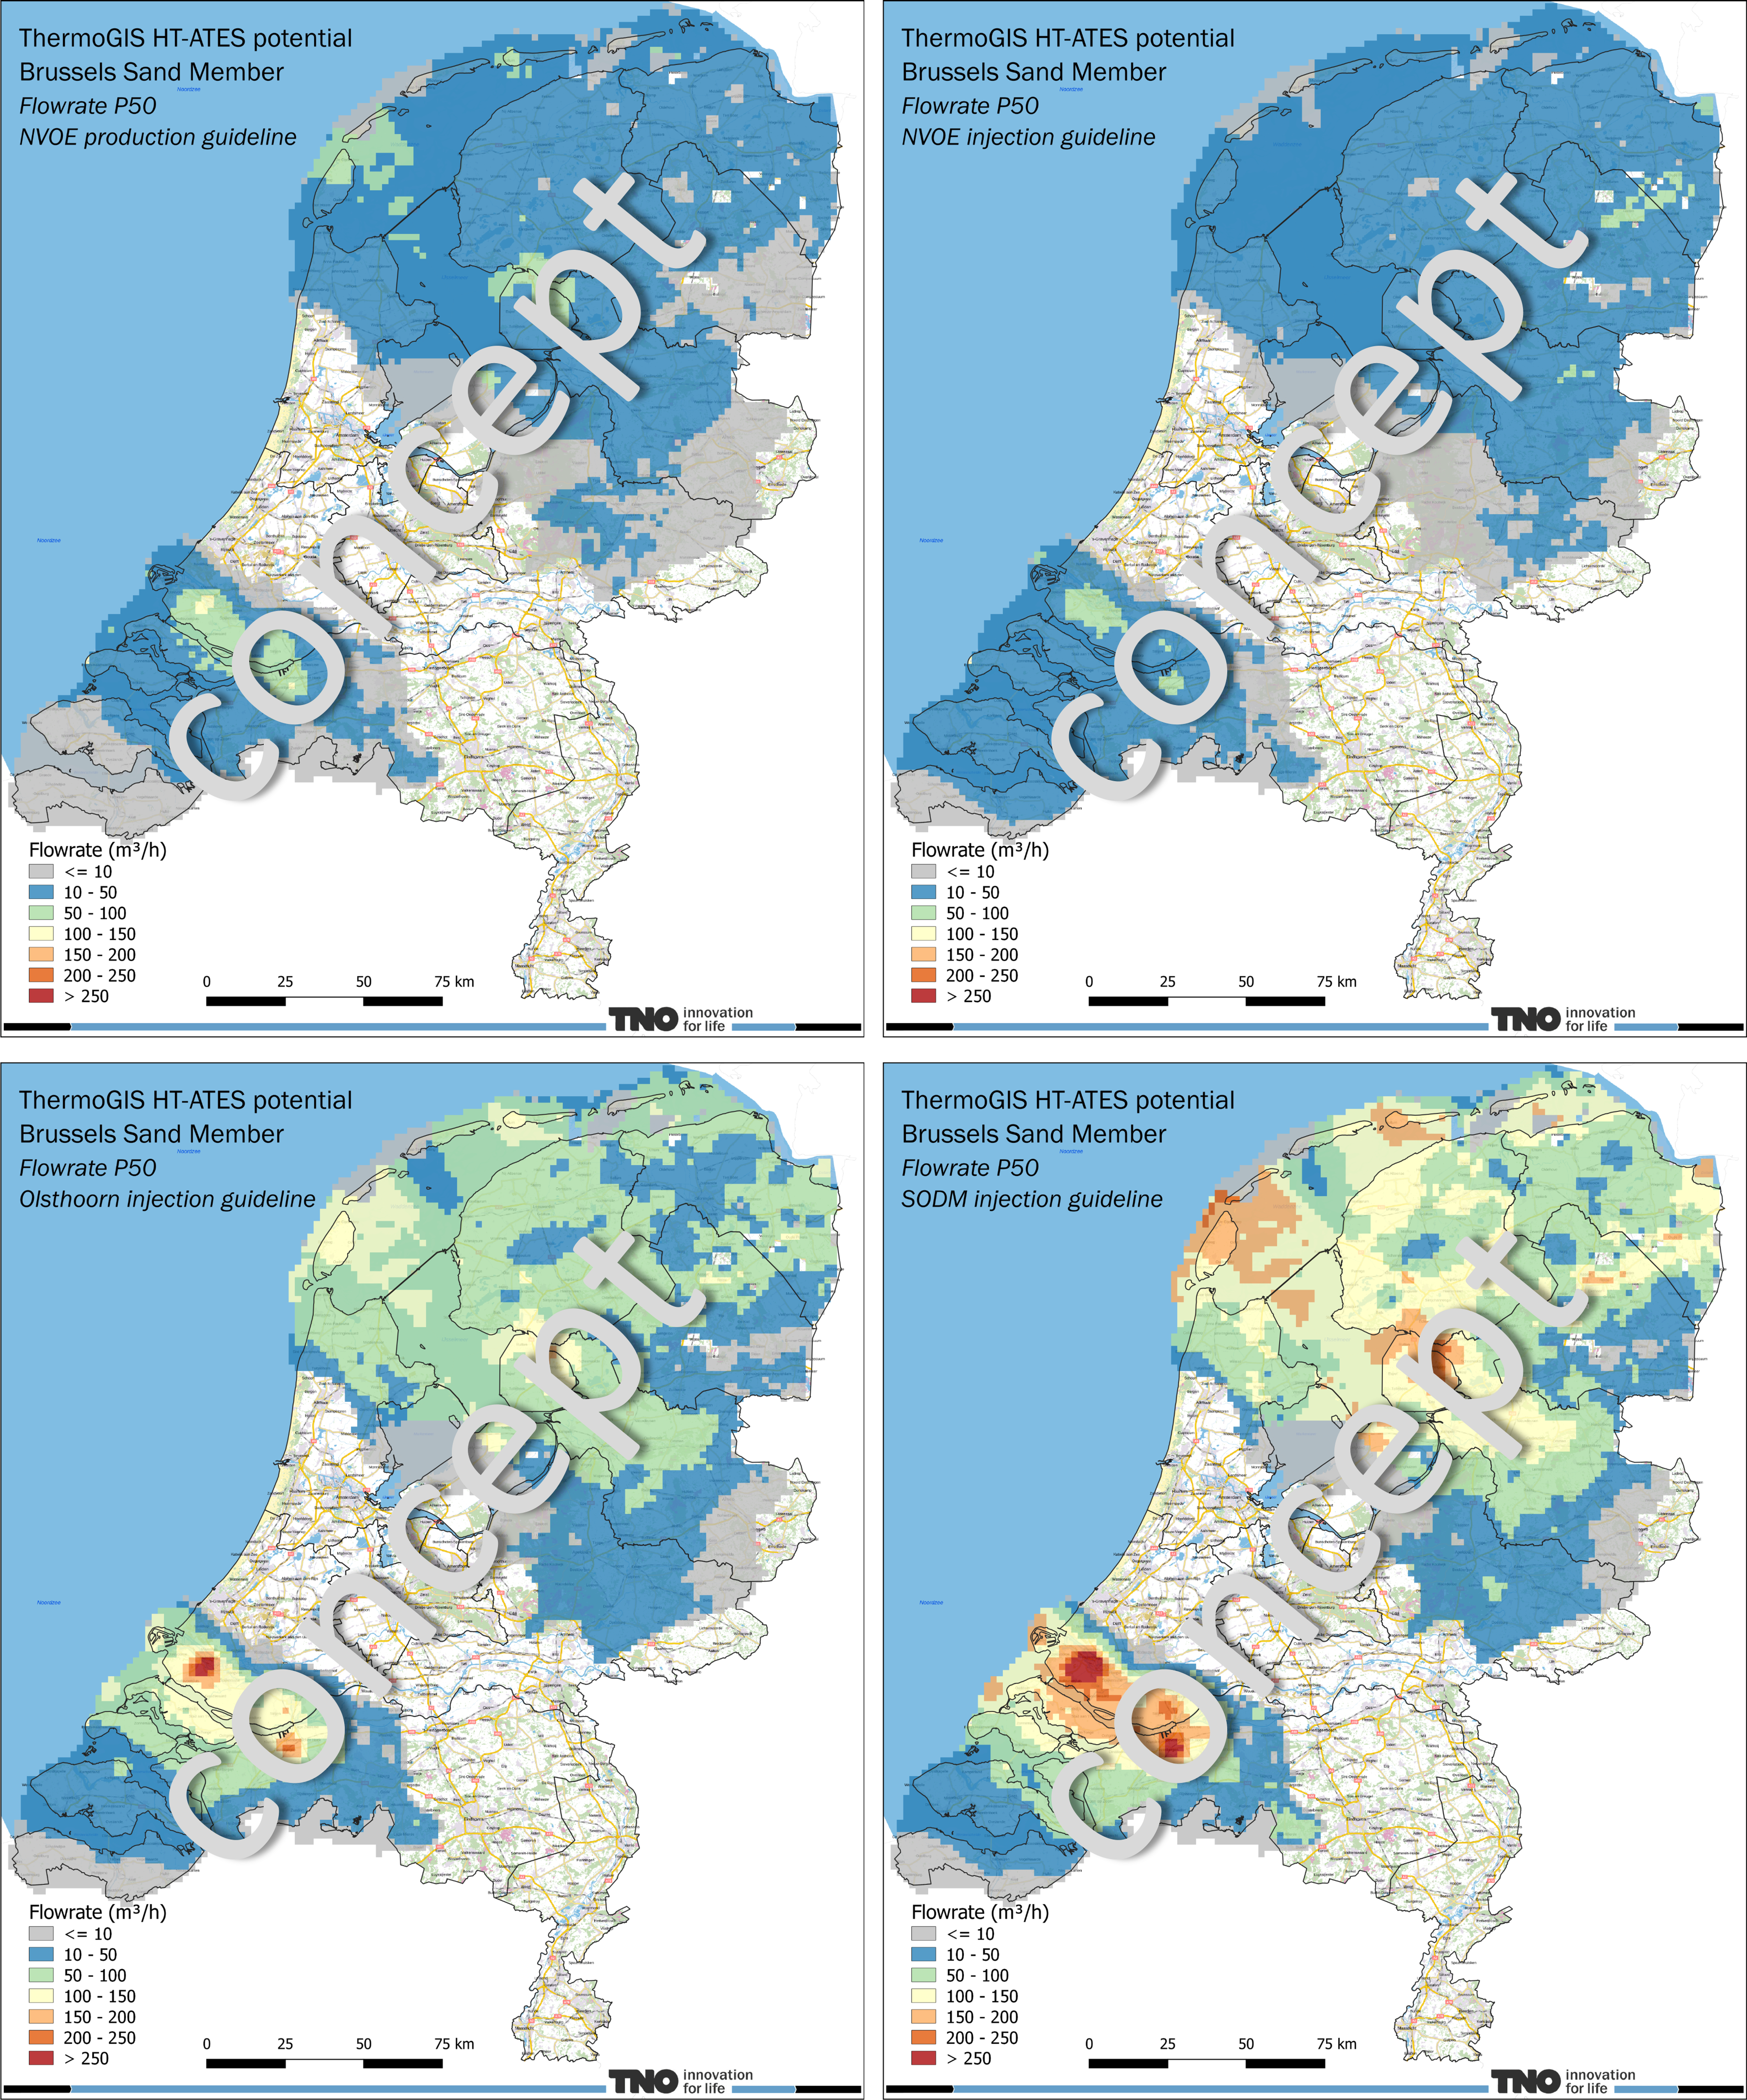
Example maps: Brussels Sand Member
Initial calculations have been carried out for the Brussels Sand Member. The reason this unit was chosen is that it is buried at relatively shallow depth, and has been re-mapped in WarmingUP using new and improved data. As a result, the uncertainty is smaller than for other members and formations within the ATES depth range.
The figures below show the maximum achievable flow rates (m³/h) for an ATES well, calculated using the property maps also used for ThermoGIS. Each example map was calculated using a different method for the maximum allowable flow rate. Therefore, the results of the four methods differ significantly.
The map on the bottom right was calculated using the standard for deeper aquifers (>500m) that is also used in ThermoGIS. The other three were created based on standards for shallow aquifers (with a simplified correction for depth). The ATES typical depth range lies in between these two ranges. It is therefore important to determine the most appropriate calculation method for ATES.
Relevant documentation and background information
The report explaining the ThermoGIS-HTO application and the example maps can be downloaded here: Vrijlandt at al. (2023). ThermoGIS-HTO: National High Temperature Aquifer Thermal Energy Storage potential tool.
The WINDOW phase 1 (predecessor of the WarmingUP project) report, with qualitative approach to HTO potential: Dinkelman et al. (2020). B2 potentieel en toepassingscondities. Geologisch model, temperatuurmodel voor de ondiepe ondergrond en potentieelkaarten voor HTO in Nederland.
Project: WarmingUP (theme 5)
This project was carried out as part of the Innovation Plan WarmingUP. It was enabled in part by a grant from the Rijksdienst voor Ondernemend Nederland (RVO) under the subsidy scheme Multi-Year Mission-Driven Innovation Programmes (MMIP RVO project number TEUE819001). WarmingUP fulfils MMIP-4 Sustainable heating and cooling in the built environment, thus contributing to Mission B - A CO2-free built environment in 2050.
Contactpersoon
Do you have suggestions or questions about the ThermoGIS-HTO application or this page? If so, please contact Dorien Dinkelman. For other ThermoGIS questions, please get in touch via the contact form on this website.