
Temperature is a key variable when assessing the geothermal potential of an aquifer; it doesn’t matter how permeable or thick an aquifer is, if the temperatures are low then the economic potential of the aquifer is also low.
We know that on average the geothermal gradient of the Netherlands is approximately 30 degrees per kilometer; however this varies strongly from location to location and this variation is primarily driven by the thermal conductivity and (to a lesser extent) the radiogenic heat of the rocks beneath the surface.
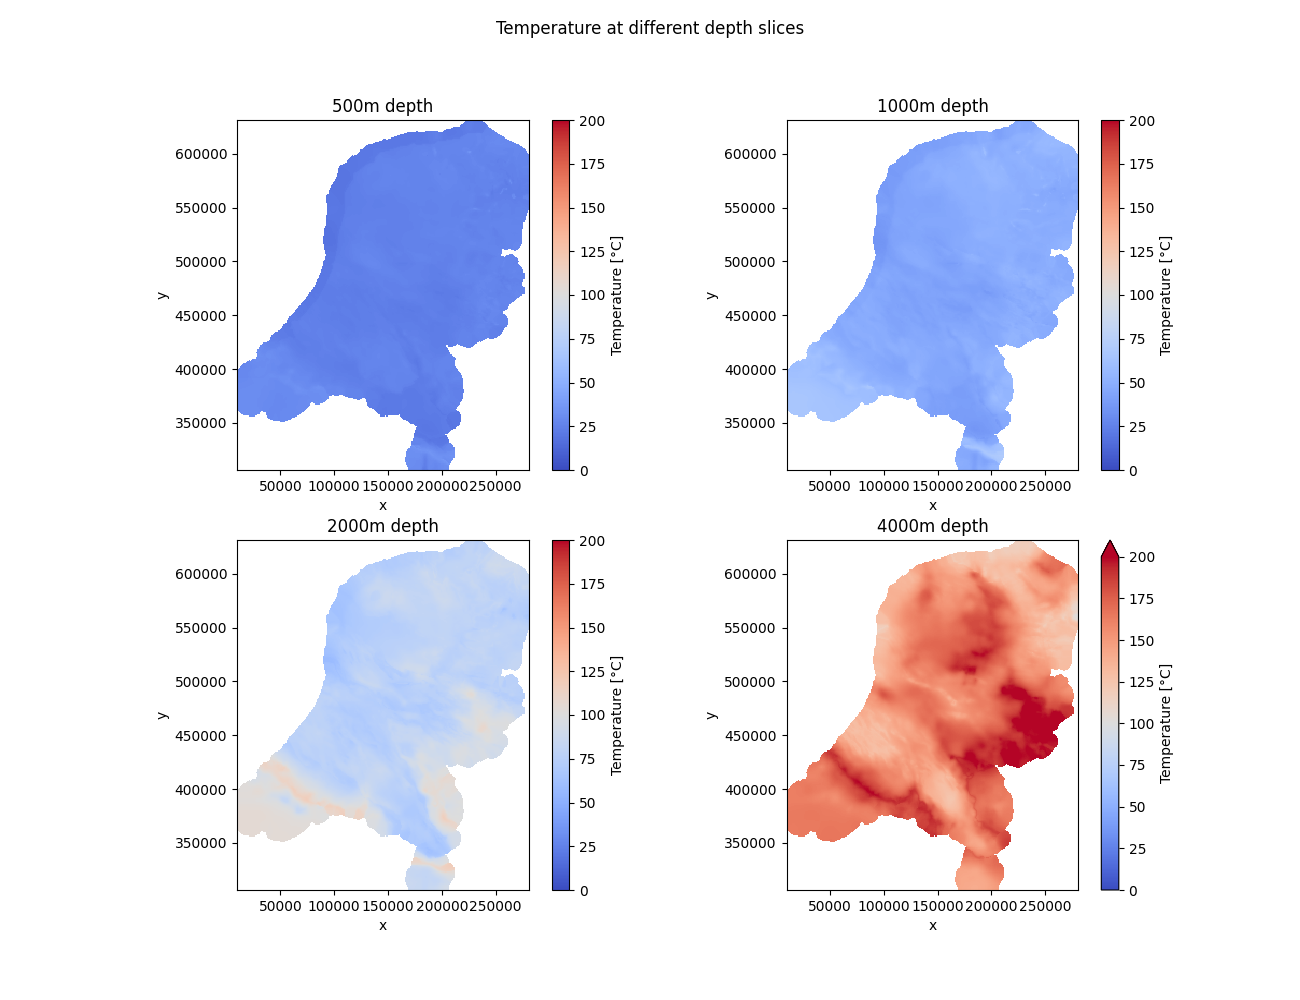
To solve for this 3D temperature field we use the methodology of Békési et al. 2020; this method solves the steady state heat diffusion equation with radiogenic heat production in 3D using finite difference and Ensemble Smoother Multiple Data Assimilation (Emerick and Reynolds, 2013) to adjust our conductivity and radiogenic heat estimates to fit borehole temperature data. Currently these are mostly Horner corrected bottom h ole temperatures. We solve for temperature on a grid of 1000m x 1000m x 200m down to a depth of 10km.
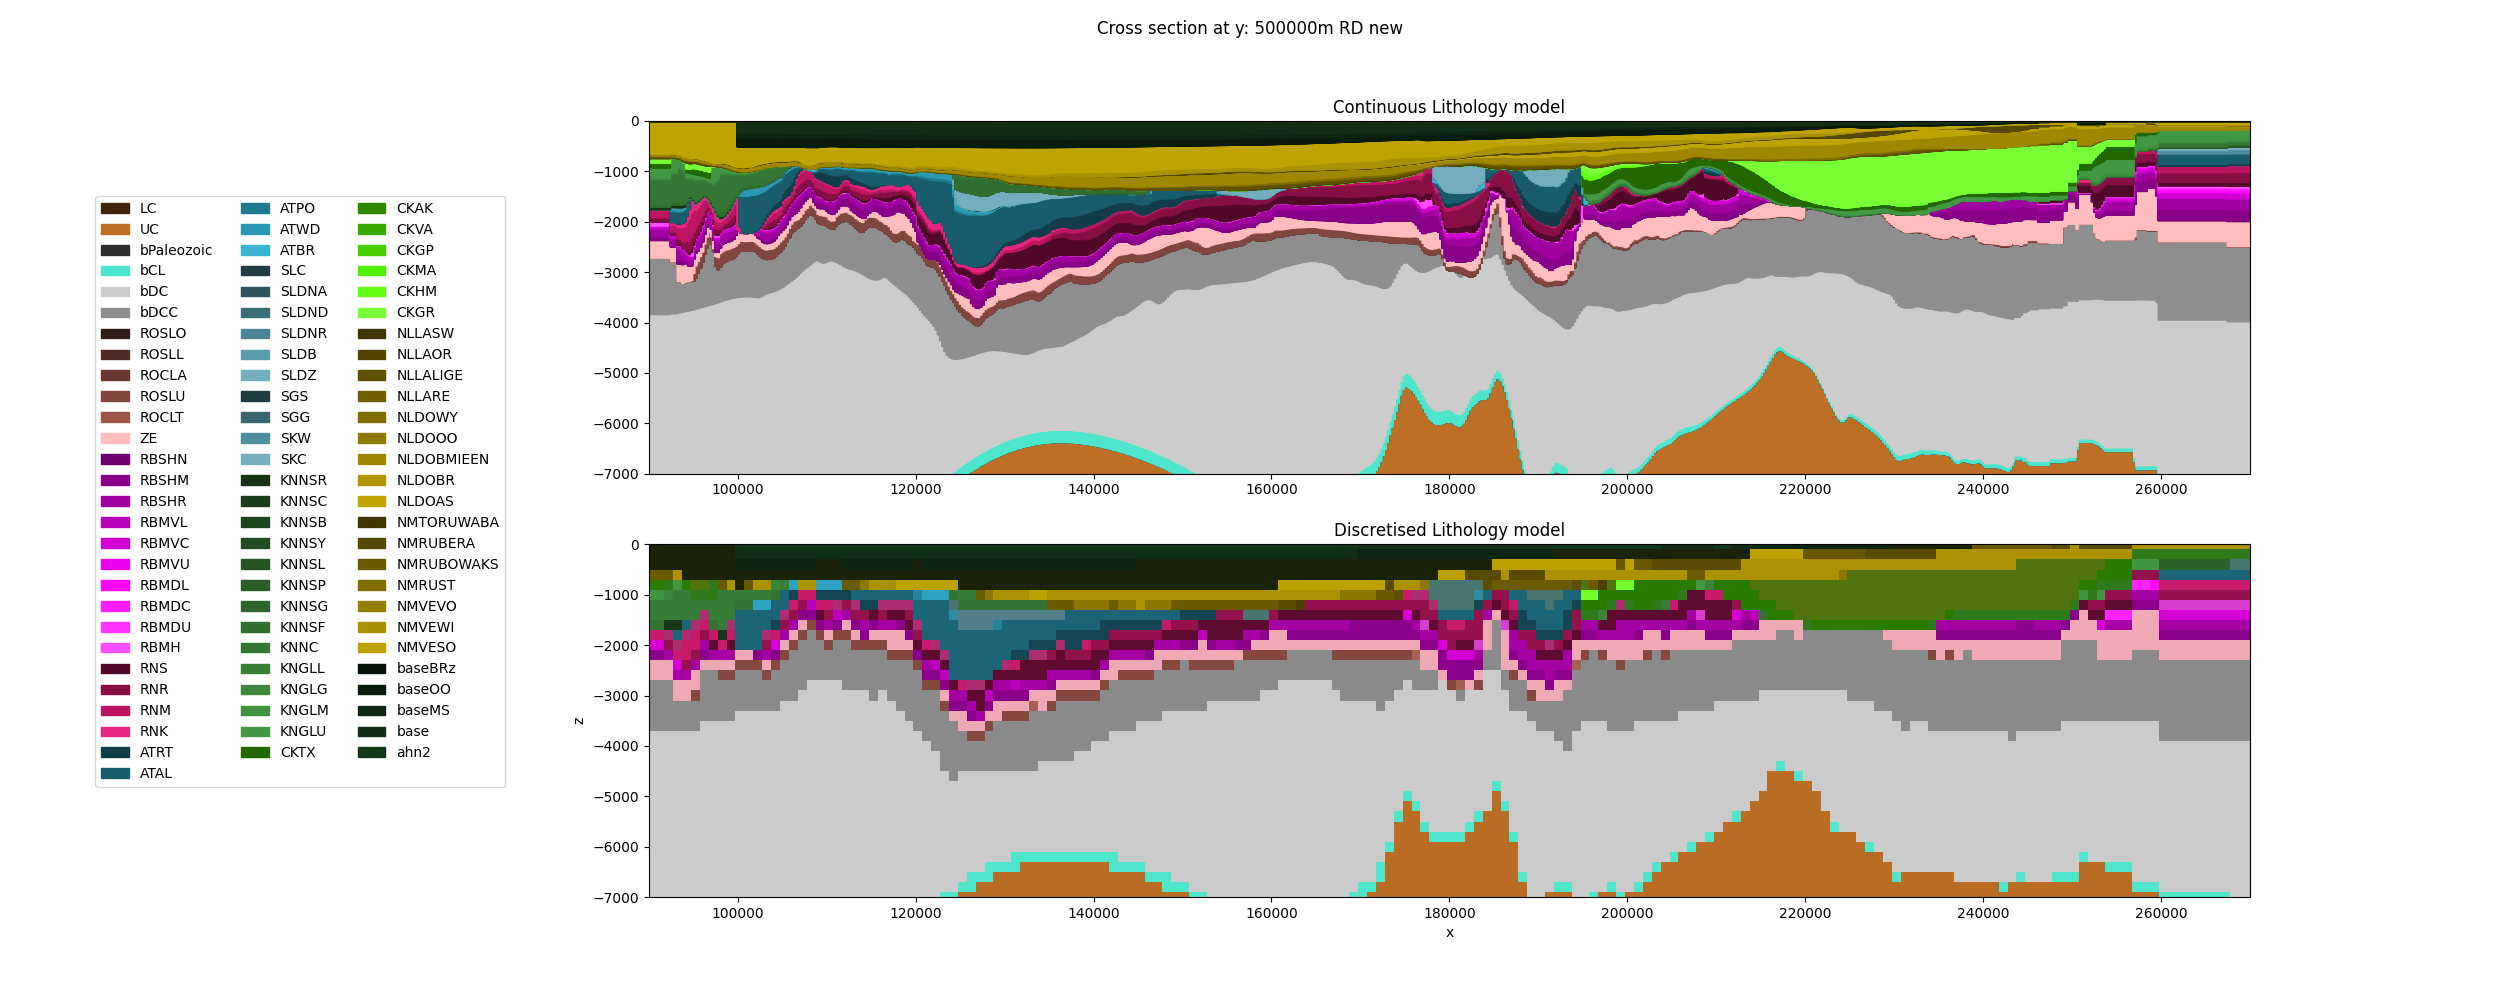
The temperature model produced and published by Békési et al. 2020 was built on the litho-stratigraphical model DGM Deep v5. This model was released in 2019, and consists of base depth maps of the main geological Groups in the Netherlands: 13 in total. However, since 2024 it has become possible to map out the geological Formations of the Netherlands on a national scale using a combination of DGM Deep layers and well based formation thicknesses. For the updated 2025 Temperature model we have produced a higher resolution litho-stratigraphical model. The number of distinct geological layers has increased to 82. These layers are less heterogeneous than the DGM Deep Group layers. Therefore it has been possible to assign thermal properties to the model cells more accurately.
Initially, porosity, thermal conductivity and radiogenic heat production are assigned to all layers of the temperature grid based on a rough estimate of the rock content, and textbook values (Hantschel & Kauerauf, 2009). A temperature for each cell is determined by solving the steady-state heat equation in 3D. The calculated temperatures are compared with a database of temperatures measured in the subsurface. Then, the predetermined thermal properties radiogenic heat production and thermal conductivity are iteratively adjusted to minimise the difference between the calculated and measured temperatures.
In this way, temperature estimates of the Dutch subsurface are generated that correspond to temperature measurements, and are based on realistic estimates of subsurface thermal properties, and heat flow.
Note: if using maps from before v2.5 of ThermoGIS, then the temperature model of Békési et al. 2020 was used. Also, for v2.6 the database with measured temperatures was greatly improved in comparison to earlier versions.
References
Békési, E., Struijk, M., Bonté, D., Veldkamp, H., Limberger, J., Fokker, P. A., ... & van Wees, J. D. (2020). An updated geothermal model of the Dutch subsurface based on inversion of temperature data. Geothermics, 88, 101880.
Emerick, Alexandre A., and Albert C. Reynolds. "Ensemble smoother with multiple data assimilation." Computers & Geosciences 55 (2013): 3-15.
Hantschel, T., & Kauerauf, A. I. (2009). Fundamentals of basin and petroleum systems modeling. Springer Science & Business Media.